“Targeted Price – Efficiency Chart” Report now available in Price2Spy
Since Price2Spy is a tool used by hundreds and hundreds of clients, we care a lot about our clients and their ideas – it’s what helps us build a better tool.
Therefore, upon one of our clients’ request, we have decided to add a new report for those who are monitoring Targeted price (MAP) violations.
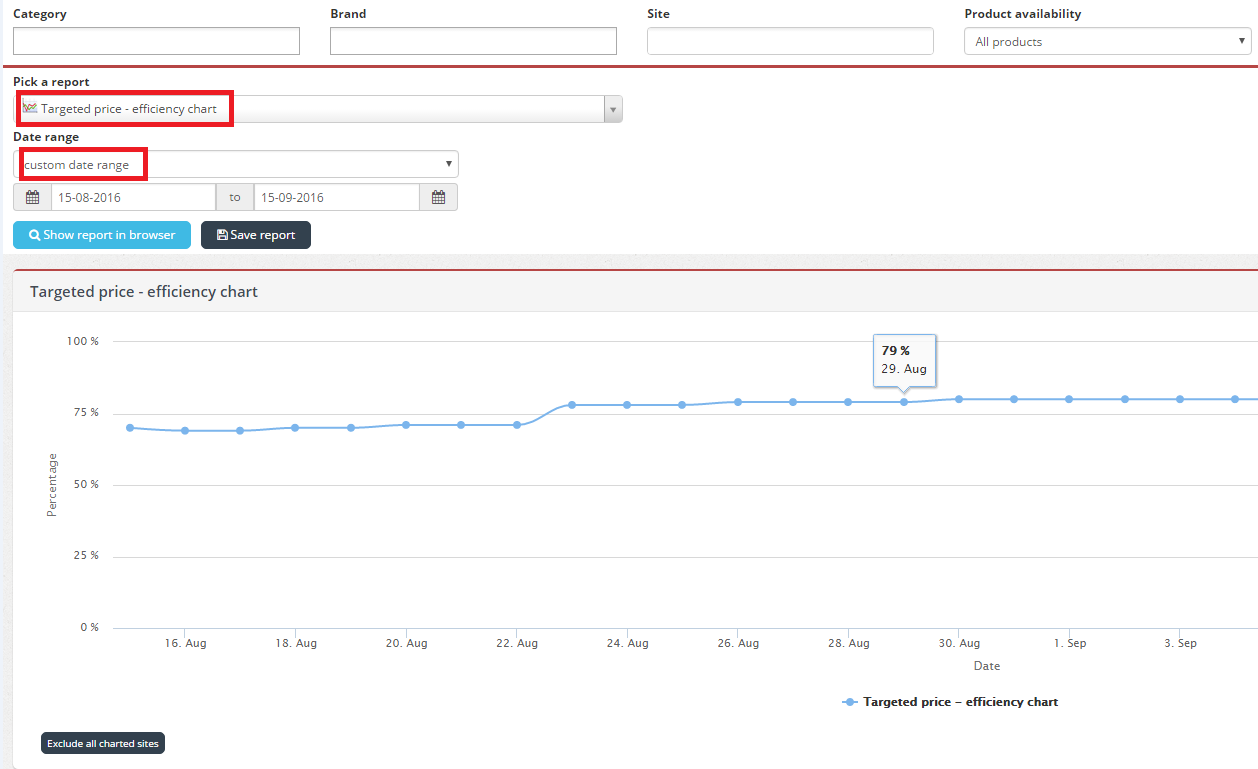
Shortly, this chart shows you a percentage of URLs you monitor that are in violation of Targeted price for a specified period.
To reach Targeted price – efficiency chart report, please follow these steps:
- Click on Reports in your account
- Then please pick the Targeted price – efficiency chart report
- If you want you can choose filters such as; category, brand, supplier and etc.
- Choose the date range that you would like to apply
- Click on Show report in browser
For example, on Aug-29, we can see that prices on 79% of all URLs from this account were lower than Targeted price, and we can see how this percentage moves during the rest of the month.
We hope that this new report will help you get the most out of our Targeted price monitoring module.