Price2Spy introduces Price Index report
Price2Spy clients are already familiar with the fact that we do not only collect raw pricing data, but also give you multiple reporting mechanisms you can use to analyze the data.
That’s why we decided to implement a brand new report in our Reports and Dashboard tabs.
From now on, you can select a Price Index report and analyze the price index based on Average price, Minimum competitor price, Maximum competitor price, Targeted price or My Price per site on a daily, weekly or monthly basis for the selected date range.
What is the Price Index?
To put it simply, the price index is a measure of how the prices from a particular site stand compared to 2 other websites offering the same products. So, for example, if your product has the price that is exactly equal to the average of all websites, then its price index would be 100. If your product is 10% more expensive than the average, your price index would be 110, however, If your product is 5% cheaper than the average, then your price index would be 95.
In other words, the Price index chart will show you how the index based on Average price, Minimum competitor price, Maximum competitor price, Targeted price or My Price for each website evolved over time.
We strongly recommend you to use the Price index while applying filter either by category or by brand – in order to analyze the pricing behavior of your competitors’ in a segmented way.
1) To run the Price Index report, please pick the report, select either you want to see the report based on ‘Average price’, ‘Minimum competitor price’, ‘Maximum competitor price’, ‘Targeted price’ or ‘My price’ and click on the ‘Show report in browser’ button.
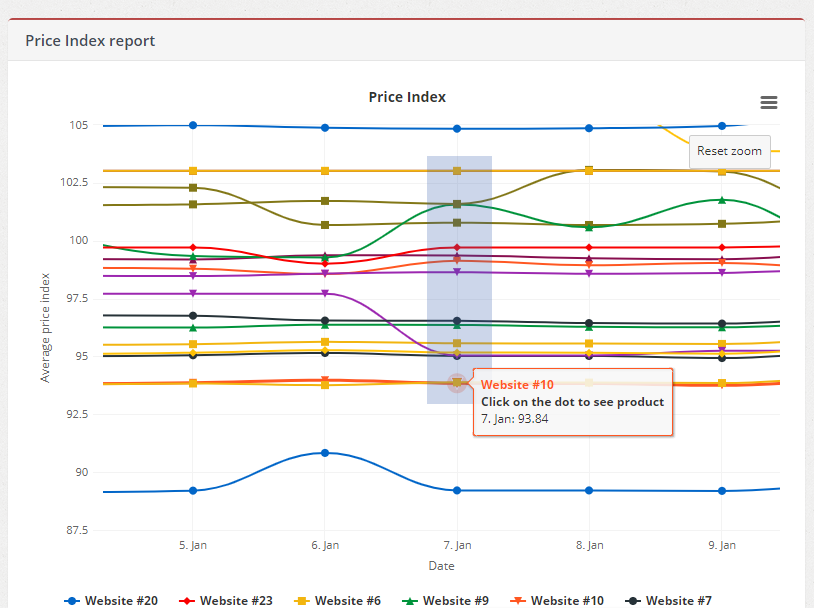
Once you run it, you’ll see a chart shows a line per site that showing average price index, day by day. Applying various filters will help you to analyze data even more clearly.
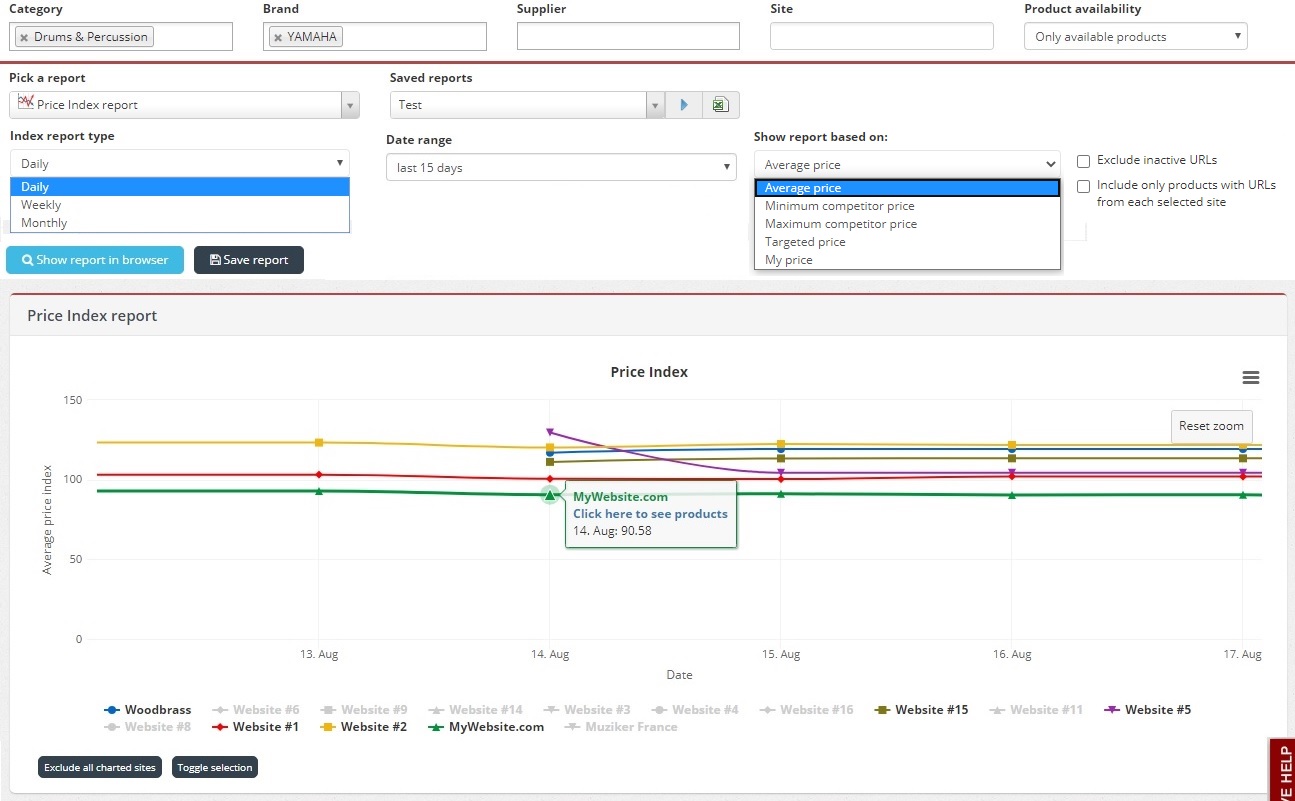
- This report also can be Saved.
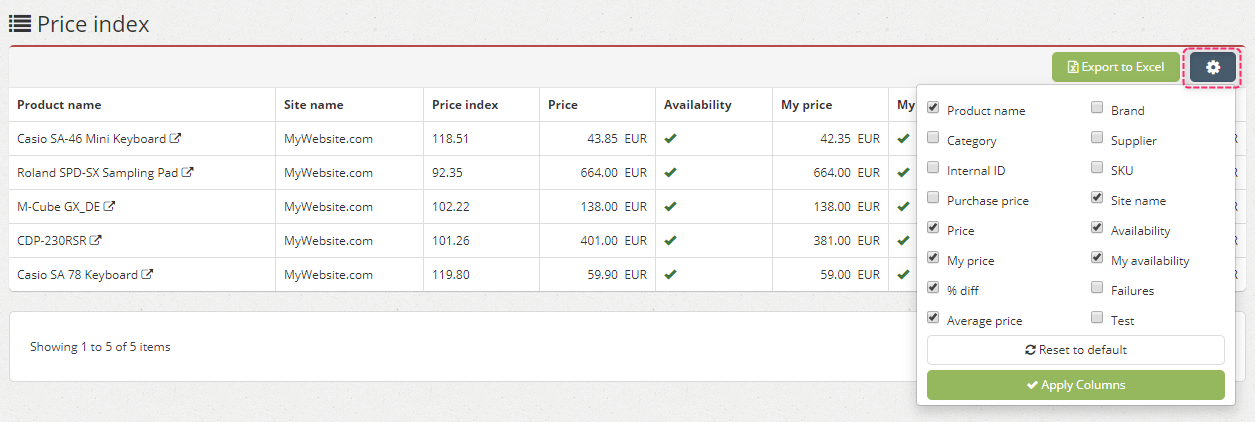
- You’ll see the details by clicking on the site name – a list of products will appear according to chosen filters and date. By clicking on the gear icon you’ll be able to customize the columns you want to see on this page.
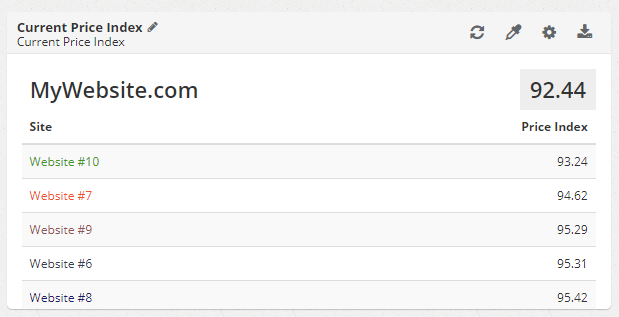
2) You can also create Price Index over time and Current Price Index widgets according to the same principles on your Dashboard.
Price Index over time widget shows you price index day by day, for your selected data range according to your chosen criteria.
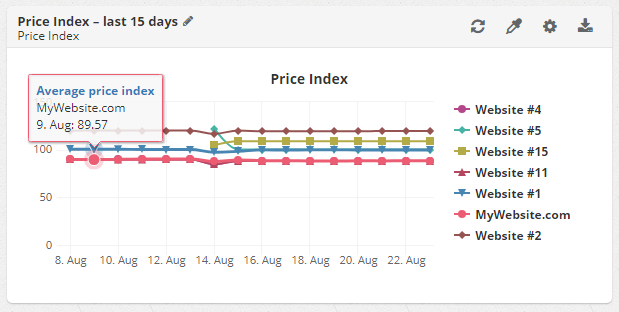
On the other hand, Current Price Index widget shows you only today’s price index, calculated according to your chosen criteria.
When creating your own Price Index widgets, you are also allowed to Exclude inactive URLs. This is something you might want to pay special attention to for the sake of your analysis.
3) Even more, in addition to the horizontal zoom, you can also vertically zoom in to the Price Index chart – both report and widget. It means that you can concentrate on the relevant parts of the y axis in the chart and see price indices more clearly.
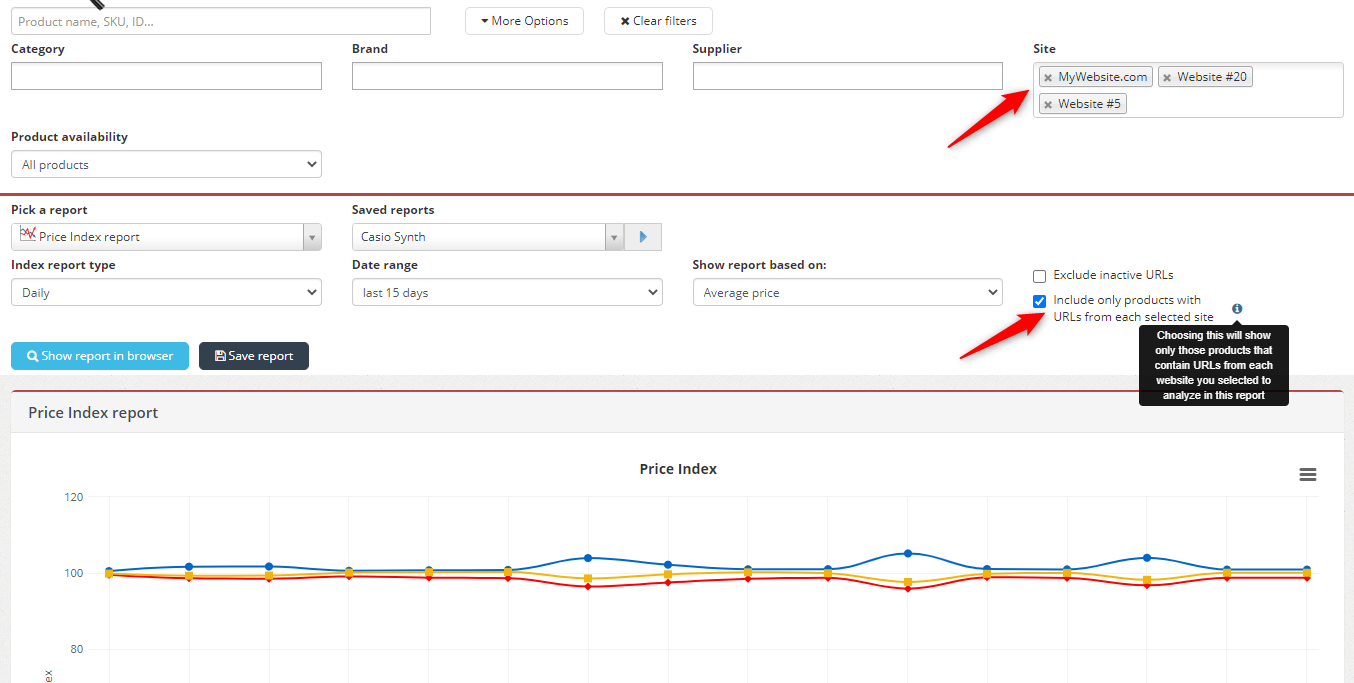
4) On top of that, if you like to run your Price Index report based on the Average price, there’s a cool feature that you might find useful.
This feature especially comes handy for those who’d like to focus on the products that contain URLs from all the selected sites. It means that, if you selected 3 sites in the filters section to be analyzed, products that contain URLs from all these 3 sites will be shown and the ones containing only one or two of them will not be taken into consideration.
However, in order to make use of it, please be sure to choose a small number of sites, otherwise, you’ll get no results. Because simply, if you select a large number of sites, there will be a small chance that they will all have a product that contains URLs from all selected sites.
5) We continue to improve one of our most popular reports – Price Index. And, it seems that we won’t stop any time soon.
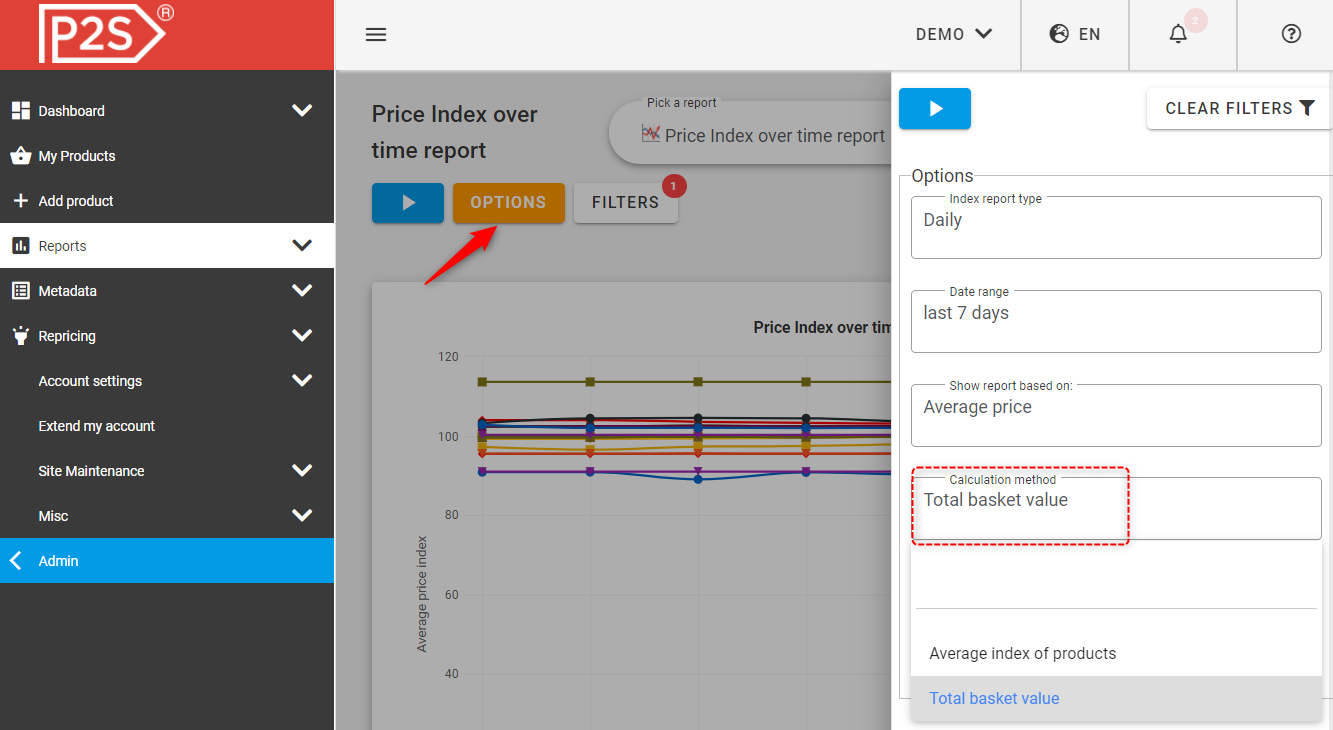
Recently, we added a new calculation method – Total basket value, in addition to the default calculation method – Average index of products.
In short, the total basket value is a price comparison method that is based on market basket, and its most common type – consumer basket. Therefore, it is most suitable for supermarkets or other FMCG products. This fairly simple method is mainly used for presentation and advertising purposes.
Click here to learn more about the total basket value and compare both methods.
To run Price Index report based on the total basket value please click Options>>Calculation method>>Total basket value.
Why is this report useful?
- You can analyze where your prices stand compared to your competitors’ prices.
- You can analyze how your retailers or dealers are pricing your products in reference to the targeted prices.
- You can compare 2 or more competitors’ prices independently from your own site.
- You can analyze average market prices for a group of products.
- You can detect which websites are monitoring each other and therefore affecting one another’s pricing strategies.
How do you like our brand new report? Please let us know – feedback is always welcome! 🙂