New zoom in options in Product history charts!
A new major addition has just been released for all Premium users – new zoom in options in Product history chart. It is now even easier to spot who dropped the price first in case your competitors / retailers tend to drop prices consecutively. Let’s take a look at a standard product history chart filtered for 3 sites that changed prices on the same day:
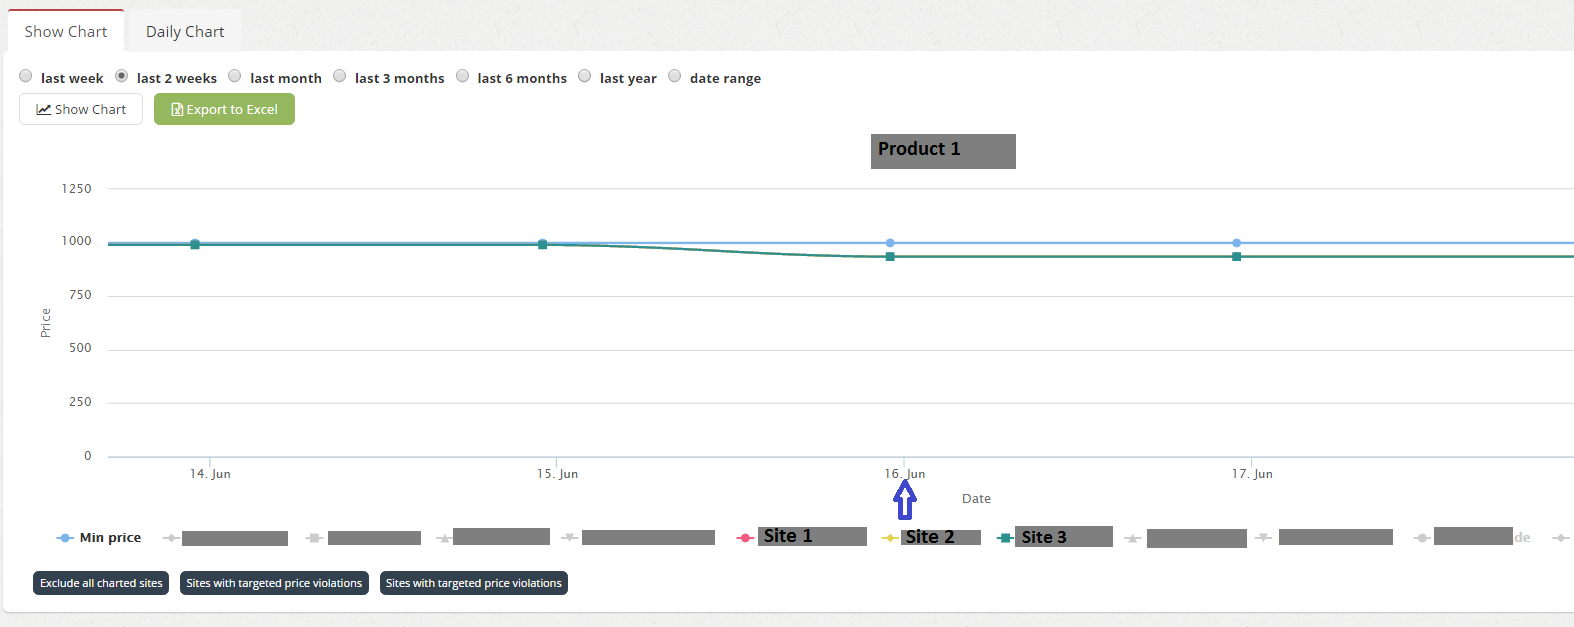
We can see it is very difficult to spot the changes since the site lines overlap and the chart isn’t zoomed in enough. That’s where our new options kick in!
Now you can click on the desired date, in this case June 16th. Also, you can click on the Daily Chart button to open the detailed view of that day’s price changes:
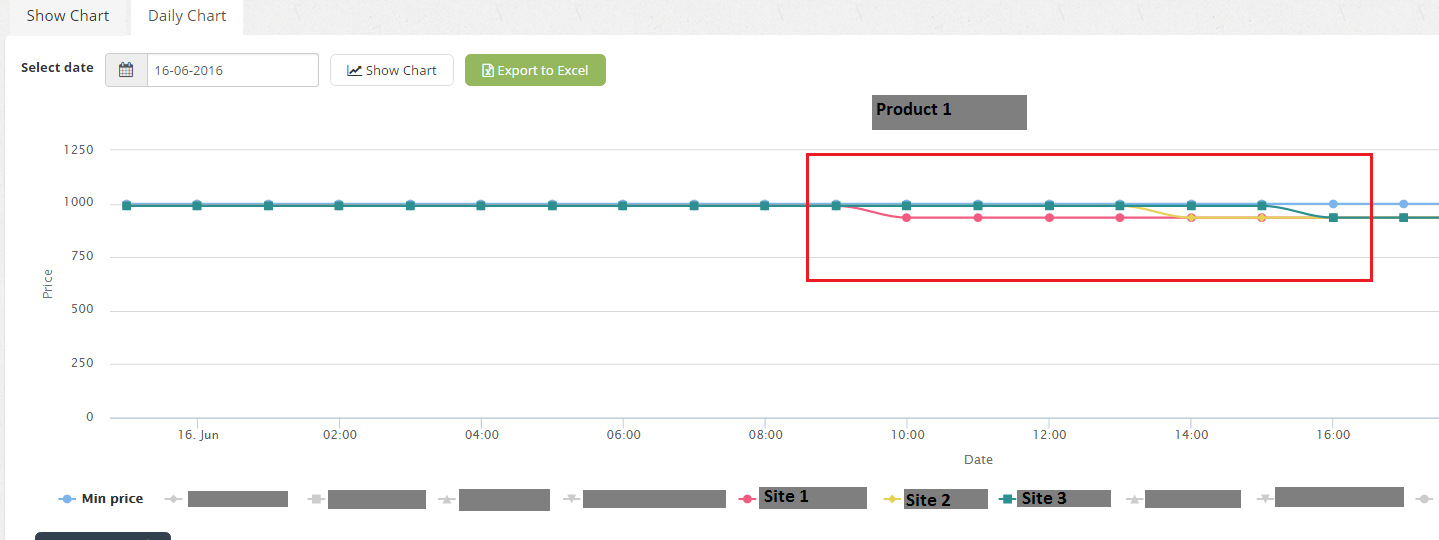
We can now clearly see that even though the price changes occurred on the same day, they occurred over the period of 7 hours. Scrolling down also gives us an hourly list of the price changes:
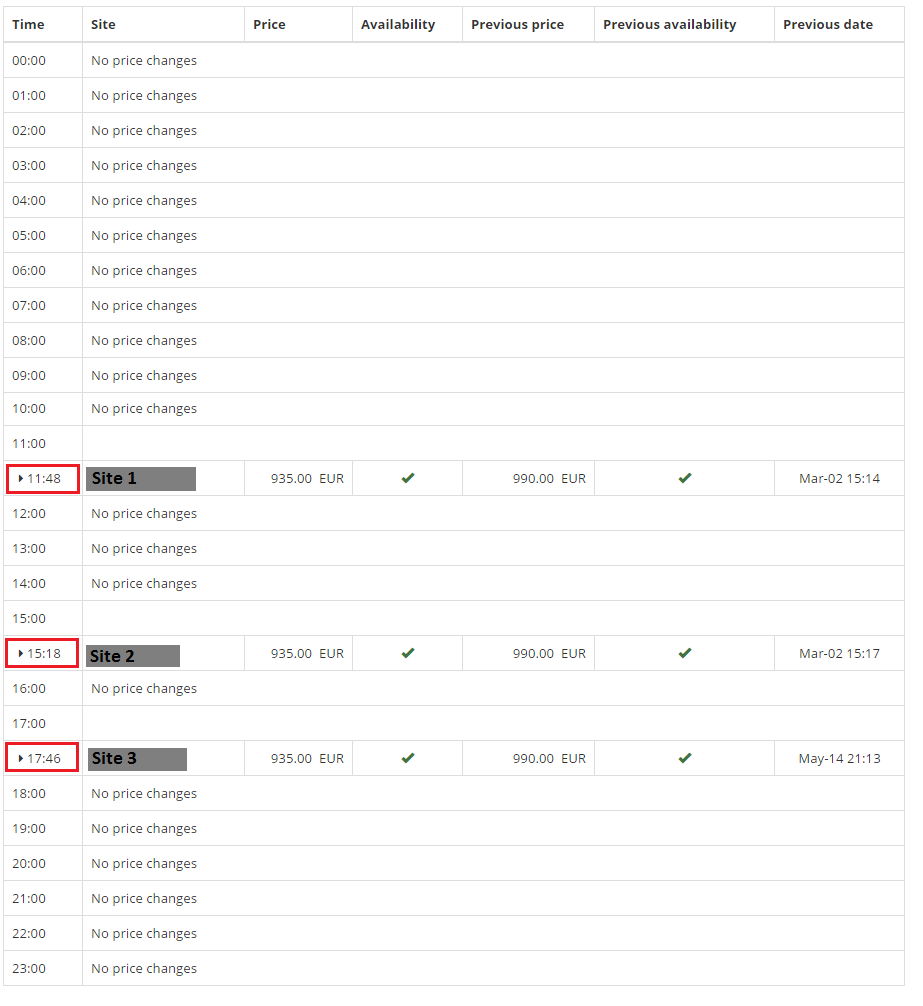
It is very easy to spot that
- Site 1 lowered the price first at 11:48
- Site 2 lowered the price second at 15:18
- Site 3 lowered the price third at 17:46
This new option makes it easier to spot and record multiple violations of Targeted price which occurred in the same day, which helps you prove who dropped the price first, and which retailers followed.
It can also help you analyze pricing patterns according which your competitors / retailers act – who leads, and who follows in the domino-effect price changes.
What do you think about our new option? We’re happy to hear from you!