Price Difference as Percentage
In another attempt to facilitate our client’s ideas we enhanced Price2spy by adding a new feature to the existing report – Price Matrix. Namely, Price Matrix was one of the most used reports since it simply gives a list – actually returns a matrix containing product names (represented by the first column) and site names (represented by the first row). With its colour code Price Matrix makes it pretty simple for the clients to spot the cheapest (green) and the most expensive (red) products / sites.
The idea of the new feature introduced in Price Matrix is to enable our clients to see the percentage by which the rest of the sites are more expensive – compared to:
1) the cheapest site
2) my own site
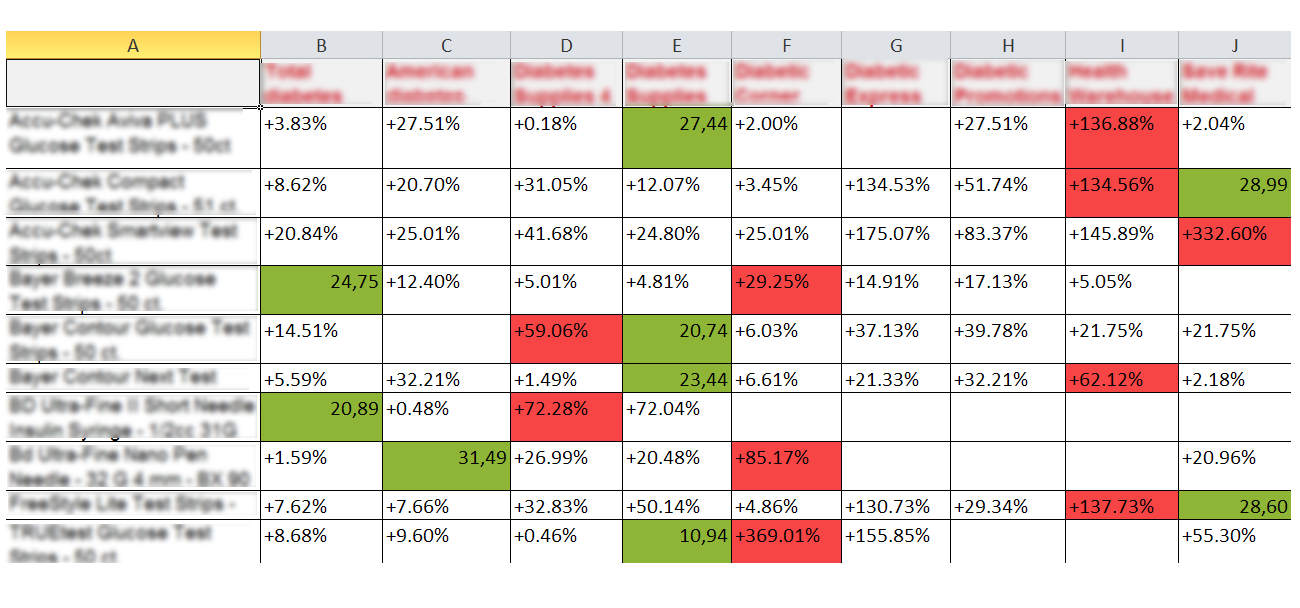
In case 1), the cheapest site price(s) are taken as a base price and shown as absolute value, while the rest of the cells are showing prices as percentages by which the rest of the sites are more expensive than base price (e.g base price is 100$, site A’s price is 110$ – base price will be shown as number (100) while site A’s price will be shown as 10%).
The following image shows Price Matrix with the cheapest price taken as a base price and it is shown as absolute value, while the other prices are shown in percents, or more precisely – by which percentage they are higher than the base price.
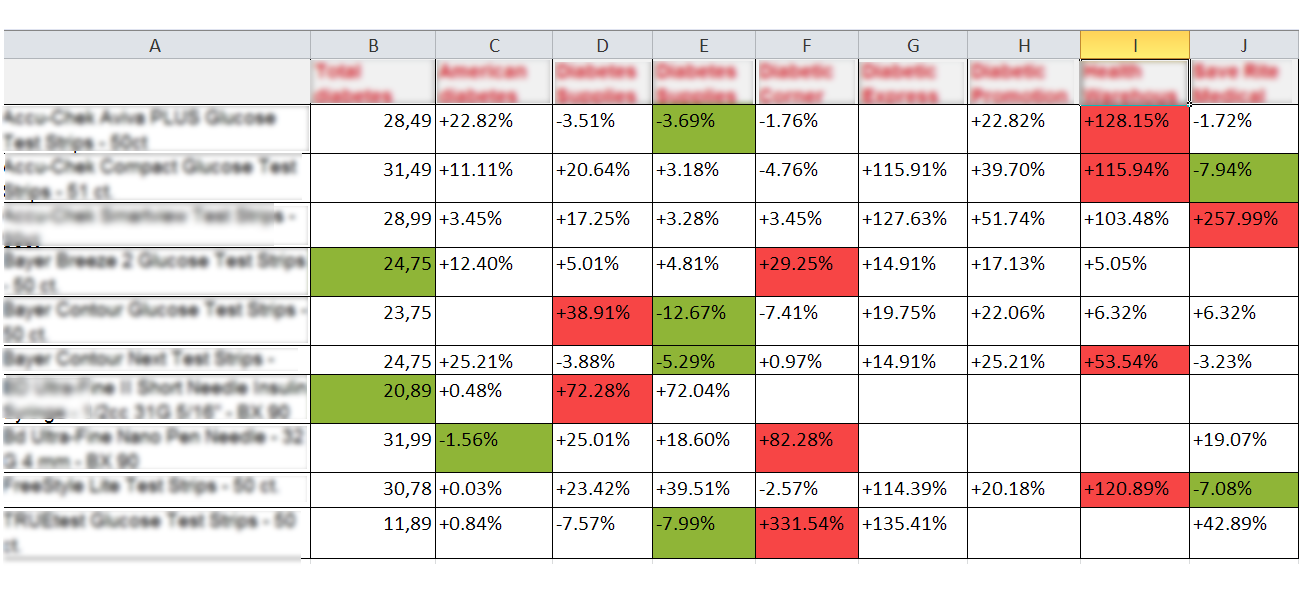
In case 2., on the other hand ‘my price’ is taken as base price and all other prices as percents. This report shows prices lower than mine as -% (minus %)and those higher than mine as +% (plus %). Prices same as ‘my price’ are shown as 0% in this report. The following image illustrates one such Price Matrix Report in action:
We do hope this report will fulfill its purpose and save our clients a lot of time comparing and calculating, thus letting them focus on developing their own pricing strategies to beat the competitors :).