Price Matrix on given date
The Price Matrix Report – a report all Price2Spy clients are very familiar with just got another important feature. Remember, initially it was only a matrix showing current prices across the competitive landscape. Later on we added an option to show price differences as percents, after which followed an additional column analyzing and showing the exact position that own prices hold in the market.
Today we present a new feature added to the Price Matrix Report – a possibility to run this report and see the exact prices on a past date.
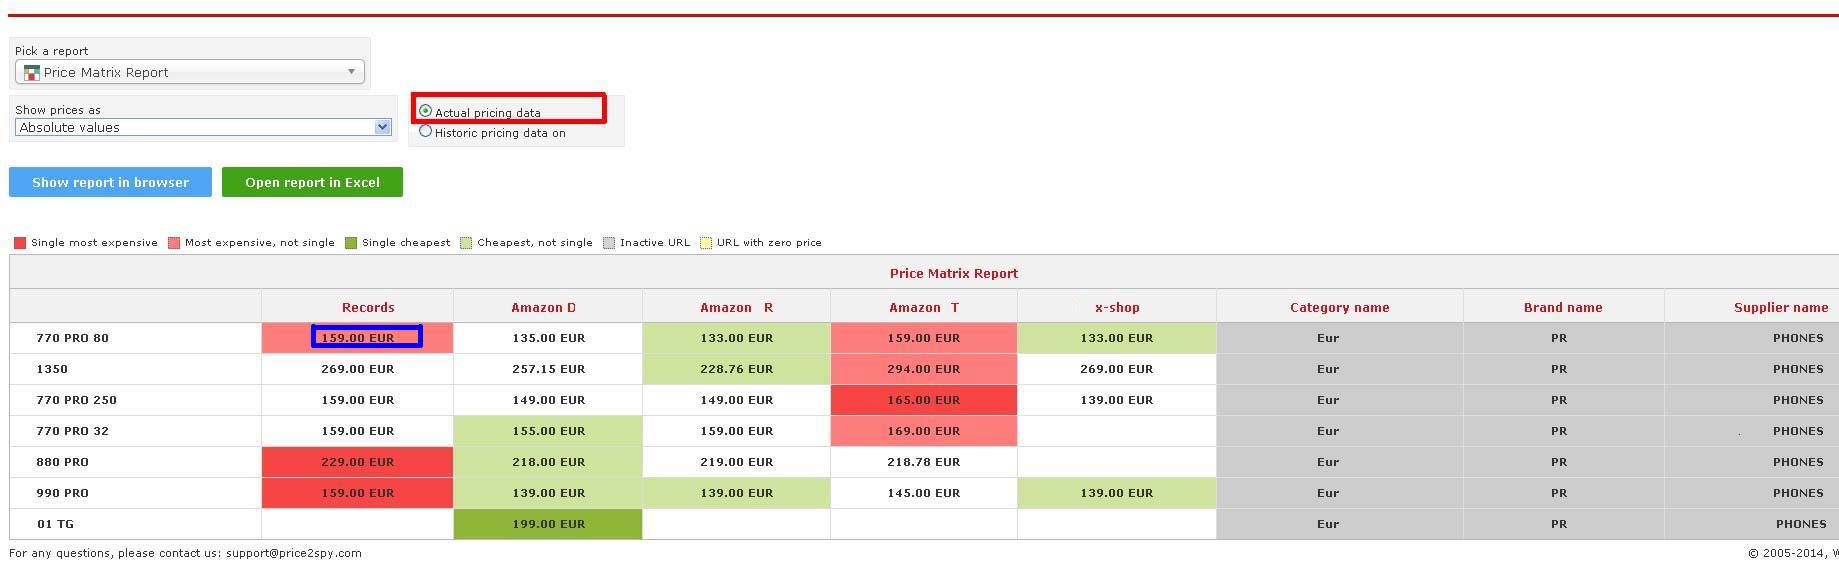
The image below shows prices as they are today (today’s prices will be shown by default when Actual pricing data option is chosen). If we focus on the first product called 770 PRO 80 we will see that it is monitored on 5 sites and the price ranges from 133 EUR to 148 EUR
To be able to see the Historic Price Matrix on let’s say June the 19th, that date would need to be chosen in the filter above the Matrix (marked in red).
The image below shows the same matrix on June the 19th. Of course there have been many price changes but if for instance we focus on product 770 PRO 80 on site Records we will see that the price on June the 19th was 135 EUR (today is 159 EUR):
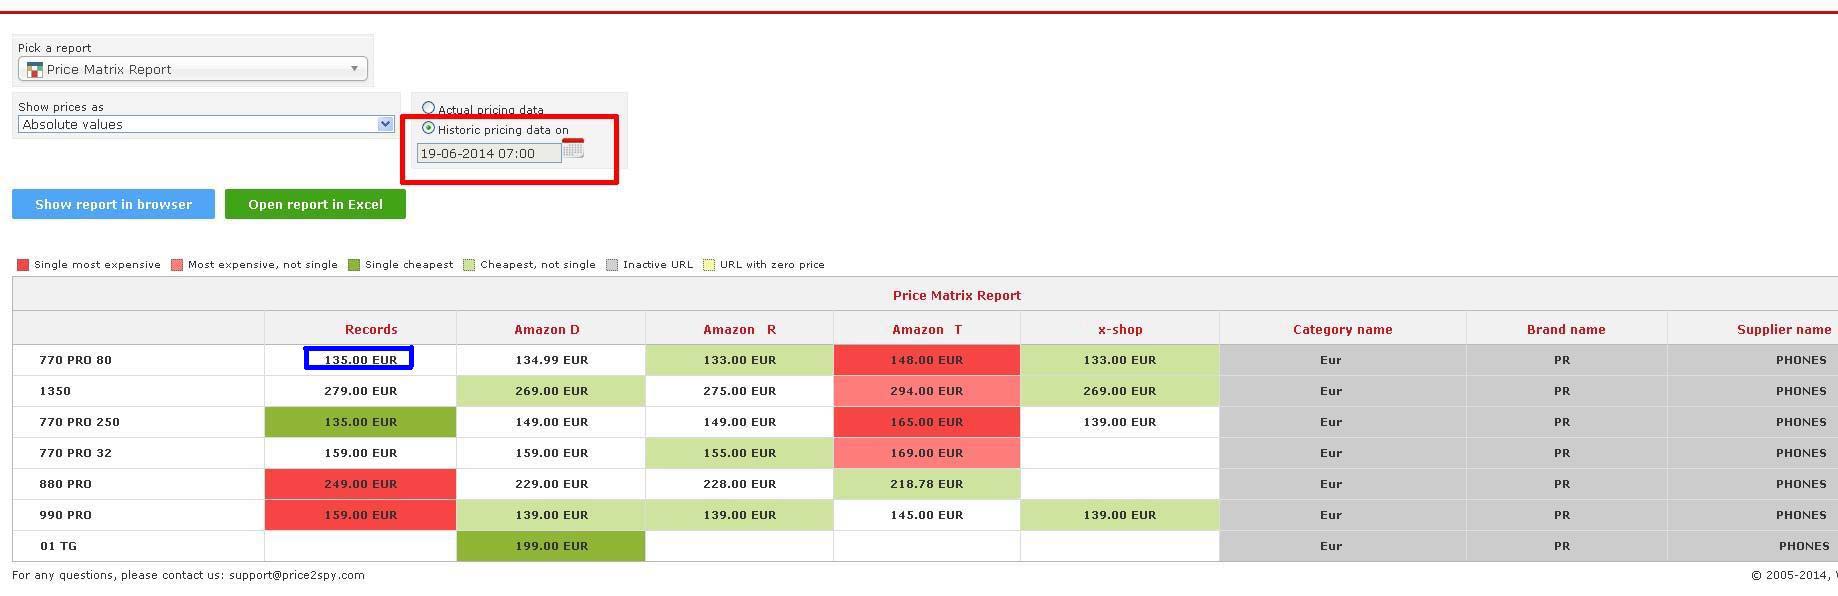
Or let’s take a look at a bigger picture – the 2 matrices show that sites Records and Amazon T tend to be on a more expensive side (red colour is prevailing in both matrices). While for the rest of sites (Amazon D, Amazon R, X-shop) green is dominant, meaning that they keep their prices quite competitive.
Hope you will make a good use of this new feature we’re so proud of!