Price History Download Available in Excel
A report that has only been available in graphical format – Price History Download now possible to be downloaded in Excel format as well, thus giving our clients the possibility to further analyze and process the data.
Given that this report gives a list of price changes for a product on all the monitored sites for a specific date range it might be well used for a number of purposes, listing just a few of them:
- Pricing forecasts / predictions – price changes to be foreseen based on the pattern of previous and current price changes
- Pricing variation analysis – price changes and variations might be well used for the data analysis, and the results might be further used for establishing a pattern of price variations
- Statistical reports – the new report offers the possibility to export product price change history chart to Excel format, and that is why it is perfect for building statistical reports on a larger scale.
Please note that this report is not classified as a standard Price2Spy Report, therefore it is not located in Reports section. To run this report:
- find the desired product (e.g. iPhone 5 white)
- choose a specific date range (e.g. 2 weeks)
- hit Export to Excel button.
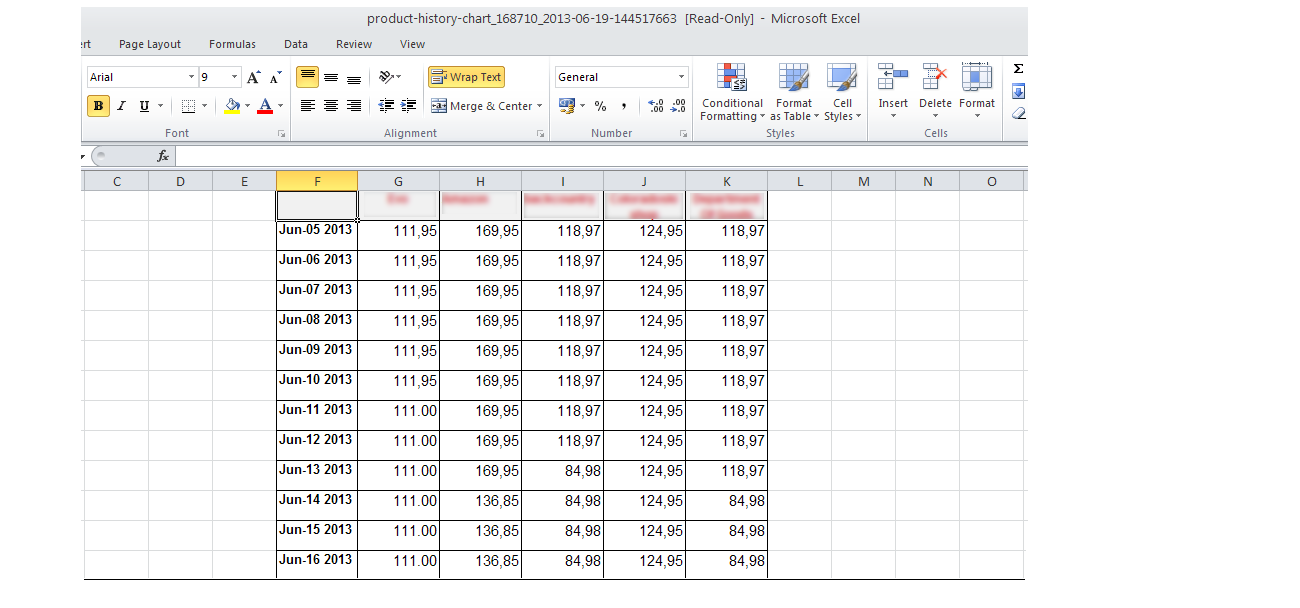
The following image shows one such report. Column F holds the dates (defined by the date range), while columns G – K show prices and price changes on the sites the product is monitored across on the dates shown in Column F. Site name is displayed (and blurred for privacy reasons) on top of each column G – K.
Btw, having this data in Excel enables you to create custom reports of your choice – using standard Excel charting features.