Price2Spy introduces Aggregate pricing trends report
Since we care a lot about our clients and their ideas, we have decided to implement a new report in our Reports and Dashbord tabs upon one of our clients’ request.
So far, Price2Spy was very good at comparing pricing data from one website to another. However, it had no means of comparing Brands (or, in similar way: Categories or Suppliers).
Therefore, we decided to do something about it.
From now on, you can select the Aggregate pricing trends report and analyze pricing trends either by Category / Brand / Supplier level according to chosen criteria below:
- Average price movement per day
- Use this option to see how various brands / categories changed their prices over period of time
- Number of price changes per day
- Use this option to see when specific brands / categories had a lot of price changes – indicating a pricing turbulence on the market
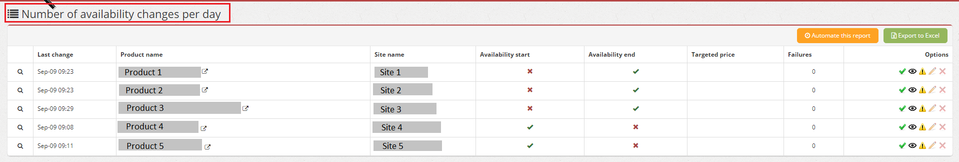
- Number of availability changes per day
- Use this option to see when specific brands / categories had a lot of stock / availability changes – indicating unstable stock levels
- Number of active URLs
- Use this option to see when specific brands / categories had a lot of products added / decommisioned
Before getting into details, it’s better to underline that this report meant to compare prices and price changes on comparable data. In other words, please include only Brands / Categories which do have comparable products – otherwise the aggregate reports won’t make much sense.
1) Average price movement per day – to run this report, please apply desired filters and then, please click ‘Show report in browser’.
For example, on the sample below, we’ve chosen various criteria in order to see average prices based on Brands last 15 days.
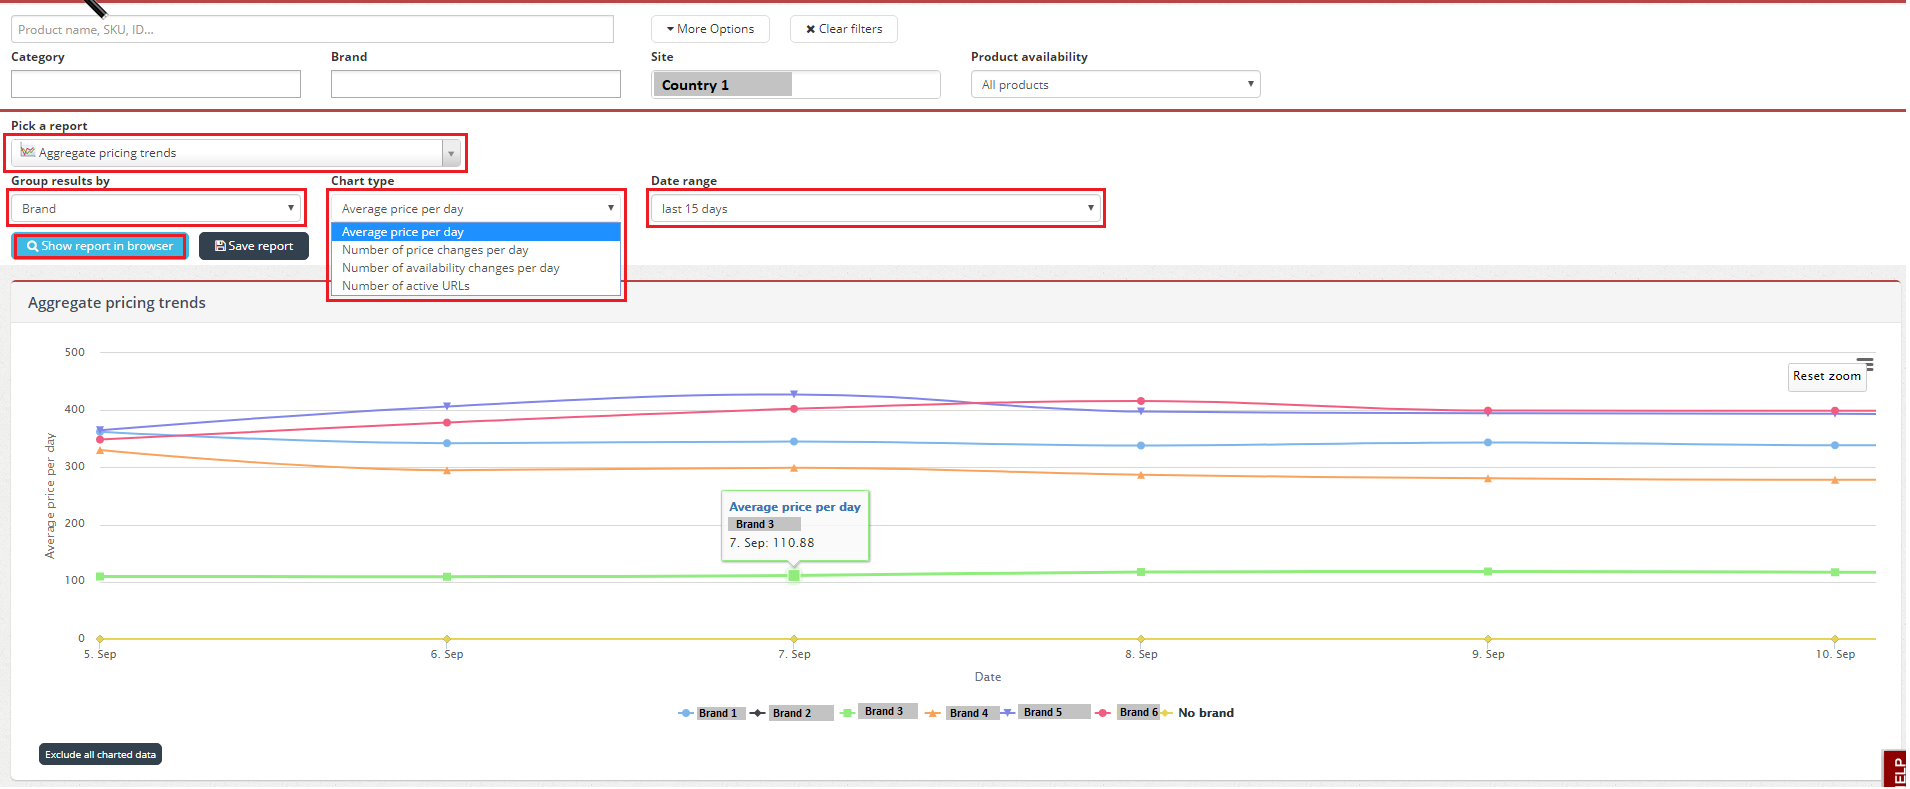
You’ll see the details by clicking on the brand name – a list of products will appear according to chosen criteria and date.
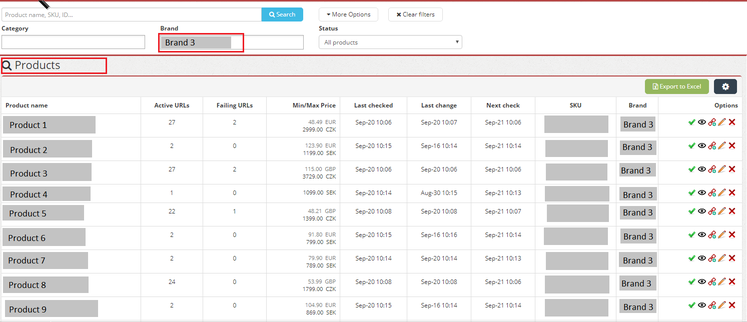
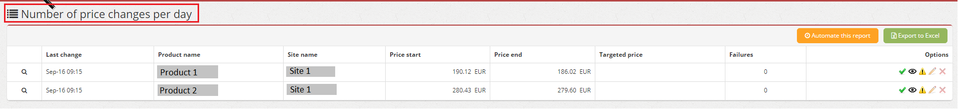
2) To see Number of price changes per day based on specific category and group results by brand you can run this report as well. Applying various filters will help you to analyze data even more clearly.
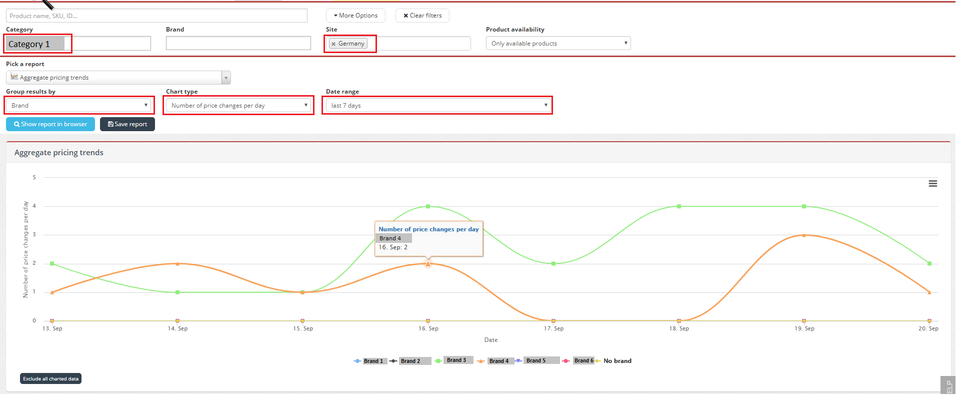
You’ll see the details by clicking on the brand name – a list of products will appear according to chosen criteria.
3) Creating a Widget – you can also create an Aggregate pricing trends widget according to the same principles on your Dashboard.
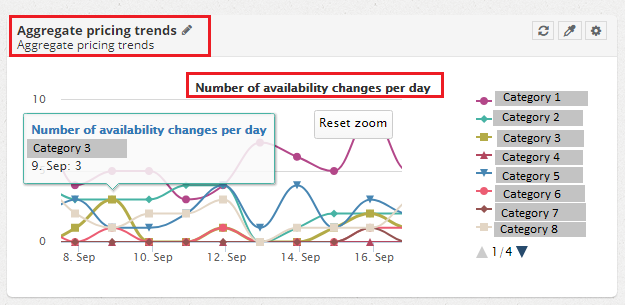
If you click on any category on the graph, you’ll see a preview of the affected products for the specif date.
How do you like our brand new report? We’d be happy to hear from you! 🙂