New setting for charting unavailable product prices
Suppose a product you are monitoring on a competitor site goes out of stock. Of course, Price2Spy will capture this change, and it will show the product as unavailable.
However, looking at Price2Spy product pricing charts – this change could be represented by
A) zero-price (a drop in the chart), or
B) its real price, still shown on website.
Ever since the first days of Price2Spy – we’ve opted for A), and most of our clients have accepted it and got used to this.
However, over the time, the number of clients who wanted B) was growing – in most cases these were manufacturers who use Price2Spy to monitor their retailers’ prices. Since we do our best to listen to all our clients’ needs, we’ve come up with a solution:
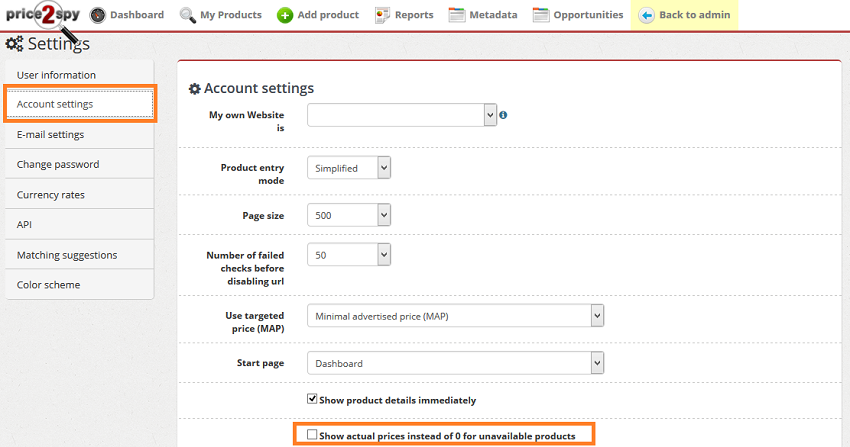
As you can see, in your Account Settings you can now specify whether you want to Show actual prices instead of 0 price for unavailable products or not.
This setting applies to the following charts / reports
- Product History Chart (shown on Product page)
- Competitor Pricing History (Excel report)
Let’s see the difference it makes on Product History Chart
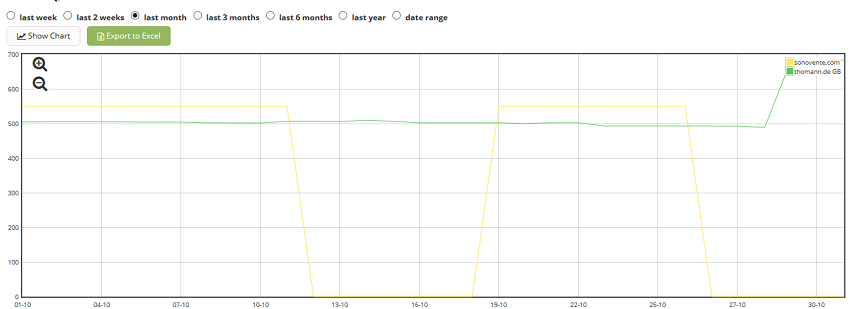
As you can see – the yellow line (representing sonovente’s price) has 2 drops – these are the days when they ran out of stock for this product.
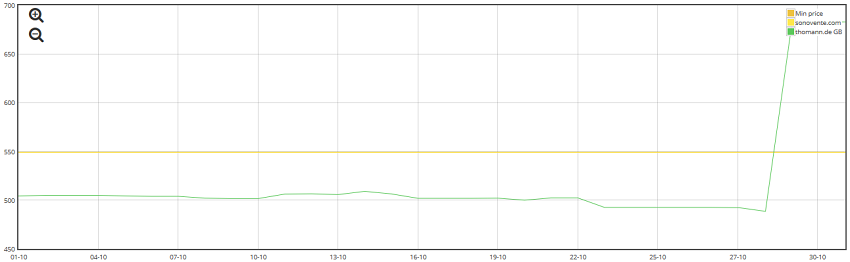
On the other hand, with this setting changed, sonovente’s price remains constant, with no drops.
Which option do you prefer?
We would love to hear back from you – your feedback would be very much appreciated.